Fall 2021 - Muhlenberg College/Morning Call Pennsylvania COVID-19 Poll
PDF: Fall 2021 - Muhlenberg College/Morning Call Pennsylvania COVID-19 Poll
Key Findings
- While over 4 in 10 adult Pennsylvanians (41%) report that they are “extremely” or “very” concerned about the COVID-19 pandemic, overall concern levels in the Commonwealth have dropped significantly from March when almost 6 in 10 residents (57%) reported high levels of concern with this health situation.
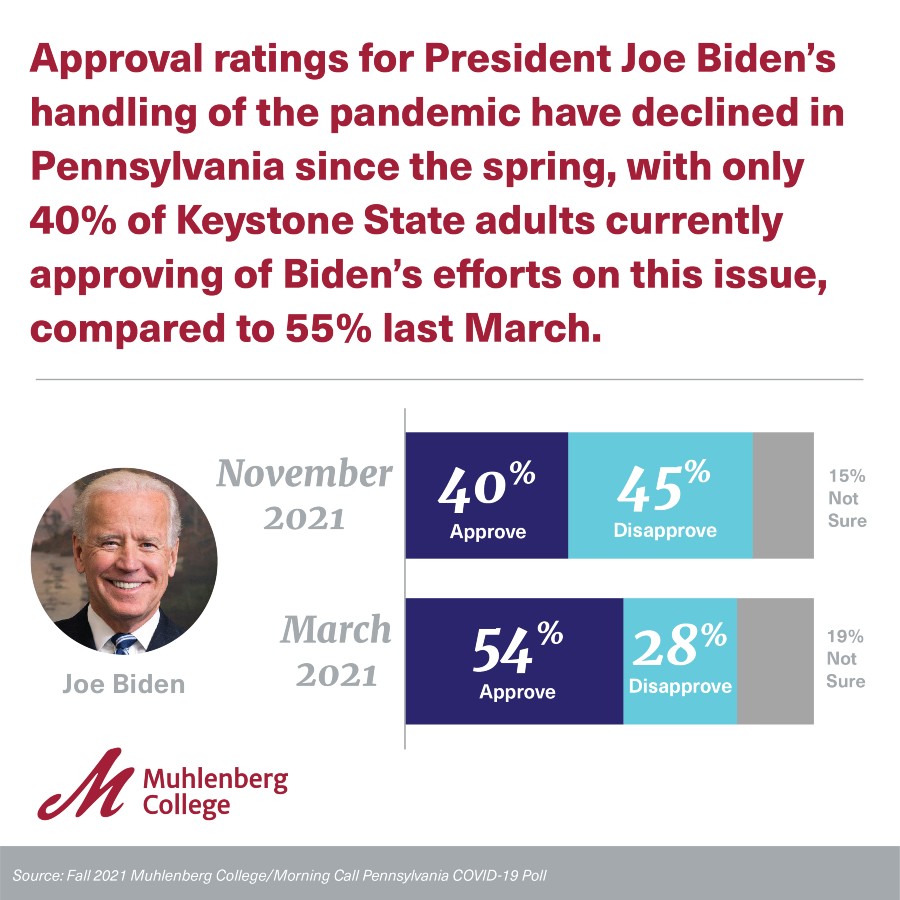
- Approval ratings for President Joe Biden’s handling of the pandemic have declined in Pennsylvania since the spring, with only 40% of Keystone State adults currently approving of Biden’s efforts on this issue, compared to 55% last March.
- More Pennsylvanians disapprove (44%) of Governor Wolf’s handling of the COVID-19 pandemic than approve (35%) of his performance on this matter
- Of adult Pennsylvanians that have received a COVID-19 vaccine, a large majority (76%) have either received or plan on receiving a booster shot.
- Over the past 3 months, 1 out of 3 adult Pennsylvanians report that the COVID-19 pandemic has had a negative impact on their mental health.
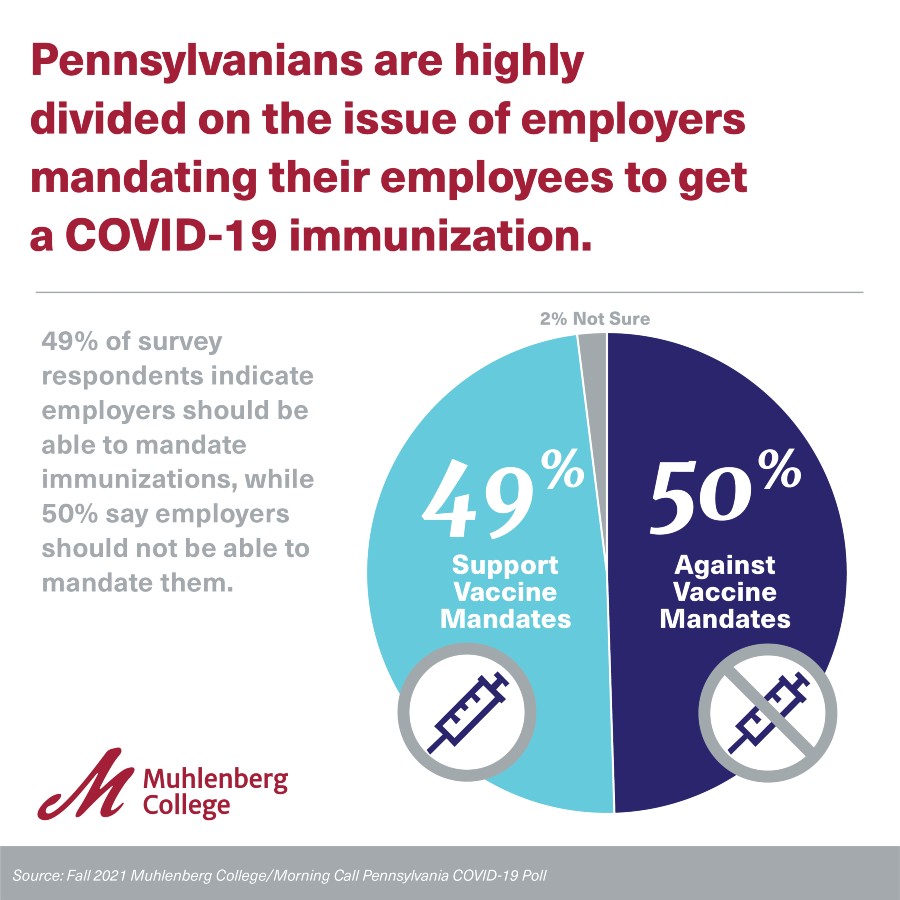
- Pennsylvanians are highly divided on the issue of employers mandating their employees to get a COVID-19 immunization, with 50% indicating that employers should NOT be able to mandate immunizations, and 49% indicating that employers should be able to establish such a requirement.
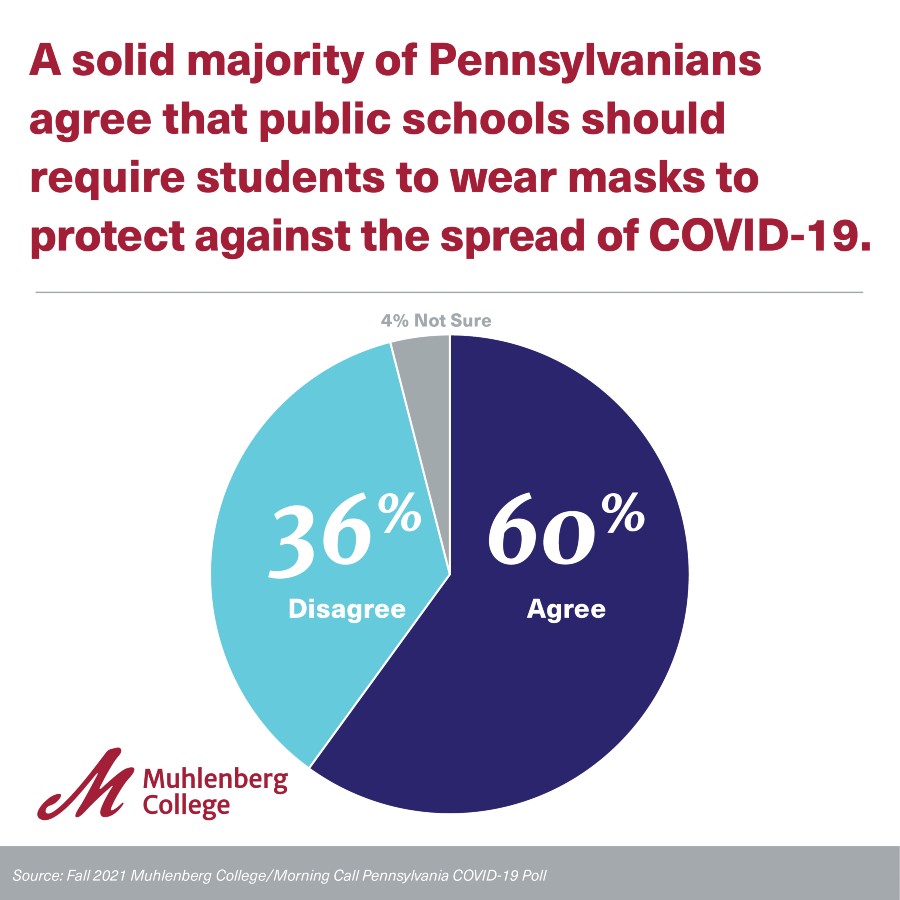
- A solid majority (60%) of Pennsylvanians agree that public schools in the Commonwealth should require students to wear masks.
- About 6 in 10 (59%) Keystone State adults indicate that individuals who have not received a COVID-19 vaccination have put others at risk and have prolonged the length of the pandemic.
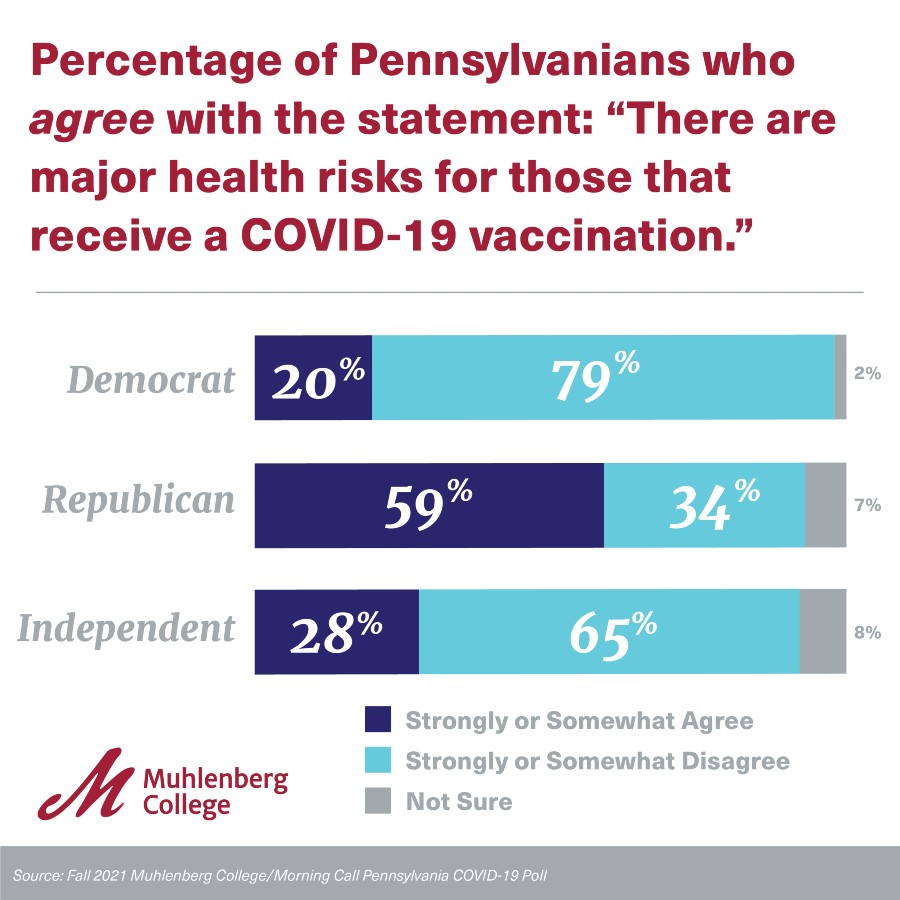
- The percentage of Pennsylvanians who agree with the following statement varies widely according to political party: "There are major health risks for those that receive a COVID-19 vaccination."
Methodological Statement
The following report contains the results of a telephone survey of 419 adults in the Commonwealth of Pennsylvania between November 15 and 22, 2021. Respondents were interviewed in English on both landlines (88) and cell phones (331). With a randomly selected sample of respondents, the margin of error for the surveys is +/- 5.5% at a 95% level of confidence. Margins of error for questions with smaller sample size will be larger. In addition to sampling error, one should consider that question wording and other fielding issues could introduce error or bias into survey results. The sample data has been weighted by gender, race, age, income, and educational attainment to reflect those Pennsylvania population characteristics as reported by the United States Census Bureau in 2021. The calculation of sampling error takes into account design effects due to the weighting identified above. In order to reach a representative sample of adult Pennsylvanians, both landlines and cell phones are called up to 5 times. The response rate for this survey as calculated using the American Association of Public Opinion Research (AAPOR) RRII formula is approximately 7%. Due to rounding, the totals provided in the frequency report may not total 100%. The survey instrument (as seen in its entirety below) was designed by Christopher P. Borick, Director of the Muhlenberg College Institute of Pubic Opinion (MCIPO), in conjunction with the staff of the Morning Call. The survey was funded exclusively by Muhlenberg College and the Morning Call. For more detailed information on the methods employed please contact the MCIPO at 484-664-3444 or email Dr. Borick at [email protected].
SURVEY INSTRUMENT AND FREQUENCY REPORT
SCREENER: Thank you. Just to confirm are you a resident of Pennsylvania who is age 18 or older?
- Yes…………..…..CONTINUE
- No………………THANK AND DISCONTINUE
- Not Sure….……THANK AND DISCONTINUE
Q1: Next I have a few questions about the coronavirus or COVID-19 outbreak. How concerned are you, if at all, about the coronavirus or COVID-19 outbreak? (READ LIST)
- Extremely Concerned…..15%
- Very Concerned………... 26%
- Somewhat Concerned…..34%
- Not Concerned at All……26%
- Not Sure (VOL)…………<1%
|
|
Fall 2021 |
Spring 2021 |
|
Extremely Concerned |
15% |
26% |
|
Very Concerned |
26% |
31% |
|
Somewhat Concerned |
34% |
28% |
|
Not Concerned at All |
26% |
15% |
|
Not Sure (VOL) |
<1% |
<1% |
Q2: Do you approve or disapprove of the way President Joe Biden is handling the response to the coronavirus or COVID-19 outbreak?
1. Approve……………….. 40%
2. Disapprove……………. 45%
98. Not Sure (VOL)……... 15%
|
|
Fall 2021 |
Spring 2021 |
|
Approve |
40% |
55% |
|
Disapprove |
45% |
28% |
|
Not Sure (VOL) |
15% |
19% |
Q3: Do you approve or disapprove of the way Governor Tom Wolf is handling the response to the coronavirus or COVID-19 outbreak?
1. Approve……………….. 35%
2. Disapprove……………. 44%
98. Not Sure (VOL)……… 21%
|
|
Fall 2021 |
Spring 2021 |
|
Approve |
35% |
40% |
|
Disapprove |
44% |
41% |
|
Not Sure (VOL) |
21% |
19% |
Q4: Have you received at least one COVID-19 vaccine shot at this time?
- Yes ……………………74%
- No…SKIP TO Q6…26%
|
|
Fall 2021 |
Spring 2021 |
|
Yes |
74% |
36% |
|
No |
26% |
64% |
|
Not Sure (VOL) |
0% |
1% |
QUESTION FIVE: ONLY INDIVIDUALS WHO RECEIVED AT LEAST ONE COVID-19 SHOT (N =307)
Q5: Have you received, or are you planning to receive A COVID-19 vaccine booster shot?
1. Yes……………………76%
2 No…………………….13%
98: Not Sure (VOL)………11%
***********ALL ANSWERS SKIP TO Q7***********
QUESTION SIX: ONLY INDIVIDUALS WHO DID NOT RECEIVE AT LEAST ONE COVID-19 SHOT (N =108)
Q6: Which of the following is your primary reason for not getting a COVID19 vaccination?
- Concerns with negative health effects of the vaccination…30%
- Religious beliefs…………………………………………….2%
- Personal liberties and choice…………………………49%
- Other (VOL)……………………………………………….11%
- All Equal (VOL)…………………………………………….6%
- Not Sure (VOL)……………………………………………..3%
REMAINDER OF QUESTIONS ALL RESPONDENTS
Q7: How effective do you think the COVID-19 vaccines are in preventing individuals who receive a vaccine from becoming severely ill from COVID-19 infections? (READ LIST)
- Very effective……………….45%
- Somewhat Effective……….29%
- Somewhat Ineffective……12%
- Very Ineffective…………….10%
- Not Sure (Vol)…………….. 5%
Q8: When you are in indoor PUBLIC SPACES do you wear masks: (READ LIST)
- All of the time……………….26%
- Most of the time……………..23%
- Occasionally…………………29%
- Or Never……………………..21%
- Not Sure (VOL)………………<1%
Q9: In the past few months, has any worry or stress related to the COVID-19 pandemic had a negative impact on your mental health, or not?
- Yes…………………………. 33%
- No………………………….. 67%
- Not Sure (VOL)……………1%
Next I have a few questions about your perception of how much risk to your health and well-being there is from the following activities. For each activity I read, please let me know if you think there is a large risk, moderate risk, small risk or no risk at all to your health and well-being.
|
|
Large Risk |
Moderate Risk |
Small Risk |
No Risk |
Not Sure (VOL) |
|
Q10: Attending in-person gatherings of friends and family outside your household |
8% |
33% |
36% |
23% |
1% |
|
Q11: Dining indoor at a restaurant |
10% |
34% |
33% |
22% |
1% |
|
Q12: Shopping at retail stores
|
10% |
37% |
32% |
21% |
1% |
|
Q13: Traveling on an airplane or mass transit
|
37% |
29% |
19% |
14% |
2% |
|
Q14: Working indoors with others in an office
|
10% |
34% |
33% |
19% |
4% |
Q15: Please indicate if you strongly agree, somewhat agree, somewhat disagree or strongly disagree with the following statements. First, there are major health risks for those that receive a COVID-19 vaccination.
- Strongly Agree………..…17%
- Somewhat Agree……….. 21%
- Somewhat Disagree……. 21%
- Strongly Disagree……… 36%
- Not Sure (VOL)………. 5%
Q16: Employers should NOT be allowed to require their employees to get a COVID-19 vaccination.
- Strongly Agree………..… 35%
- Somewhat Agree………. 15%
- Somewhat Disagree……. 16%
- Strongly Disagree………. 33%
- Not Sure (VOL)………. 2%
Q17: Adults who have not received a COVID-19 vaccination have put others at risk and have prolonged the length of the pandemic.
- Strongly Agree………..…40%
- Somewhat Agree………..19%
- Somewhat Disagree…….12%
- Strongly Disagree……… 27%
- Not Sure (VOL)………. 3%
Q18: The worst of the COVID-19 pandemic is behind us.
- Strongly Agree………..…16%
- Somewhat Agree………...41%
- Somewhat Disagree…….19%
- Strongly Disagree……… 10%
- Not Sure (VOL)………. 13%
|
|
Fall 2021 |
Spring 2021 |
|
Strongly Agree |
16% |
14% |
|
Somewhat Agree |
41% |
46% |
|
Somewhat Disagree |
19% |
16% |
|
Strongly Disagree |
10% |
9% |
|
Not Sure (VOL) |
13% |
16% |
Q19: Pennsylvania public schools should require students to wear masks to protect against the spread of COVID-19.
- Strongly Agree………..….35%
- Somewhat Agree……….. 25%
- Somewhat Disagree…….16%
- Strongly Disagree……… 20%
- Not Sure (VOL)………… 4%
Q20: Which of the following best describes the effects of the COVID-19 pandemic on your Thanksgiving holiday plans?
- I’ll celebrate Thanksgiving in the same manner as I did before the COVID-19 pandemic………..…47%
- I’ll celebrate Thanksgiving with family and friends, but with more precautions for safety than in the past………………………..…20%
- I won’t celebrate Thanksgiving with anyone other than immediate family this year because of the risks from COVID-19………….33%
- Not Sure……………………….1%
Q21: Have you contracted COVID-19?
- Yes…………………..20%
- No……………………77%
- Unsure (VOL)……3%
DEMOGRAPHICS
Q22: Finally, I have a few questions about yourself. What is your highest level of education? Is it (READ LIST)?
|
|
|
|
Less Than High School |
5% |
|
High School Graduate |
29% |
|
Some College Or Technical School |
30% |
|
College Graduate (4 Yr Only) |
24% |
|
Graduate Or Professional Degree |
12% |
Q23: Which of the following categories best describes your racial identity? (READ LIST)
|
|
|
|
White/Caucasian |
75% |
|
African-American |
12% |
|
Hispanic/Latino |
6% |
|
Asian |
2% |
|
Native American |
1% |
|
Mixed Race |
2% |
|
Or Other |
1% |
Q24: Which of the following categories best describes your current voting status? Are you registered as a (READ LIST)?
|
|
|
|
Democrat |
43% |
|
Republican |
36% |
|
Independent |
12% |
|
Other Party |
2% |
|
Or Not Registered To Vote In Pennsylvania |
5% |
|
Not Sure |
3% |
Q25: Which of the following categories best describes your religious affiliation? Are you (READ LIST)?
|
|
|
|
Catholic |
24% |
|
Protestant |
31% |
|
Jewish |
3% |
|
Muslim |
2% |
|
Hindu |
<1% |
|
Other Religion (Including Agnostic) |
28% |
|
Atheist |
6% |
|
Not Sure |
5% |
Q26: Do you have children under the age of 18?
|
|
|
|
Has Children Under 18 |
25% |
|
No Children Under 18 |
75% |
Q27: In which of the following age categories does your current age fall. READ LIST
|
|
|
|
18-29 |
23% |
|
30-49 |
29% |
|
50-64 |
27% |
|
65 and Over |
22% |
Q28: Which of the following categories best describes your family income? (READ LIST)
|
|
|
|
Under $20,000 |
10% |
|
$20,000-$40,000 |
18% |
|
$40,000-$60,000 |
20% |
|
$60,000-$80,000 |
14% |
|
$80,000-$100,000 |
13% |
|
Over $100,000 |
16% |
|
Not Sure |
9% |
Q29: Finally, to which gender identity do you most identify? (READ LIST)
|
|
|
|
Male |
49% |
|
Female |
50% |
|
Transgender Male |
<1% |
|
Transgender Female |
<1% |
|
Or you do not identify as male, female or transgender |
1% |
SELECTED CROSSTABS
|
|
Has Received at Least One Covid-19 Vaccine |
Has NOT Received at Least One Covid-19 Vaccine |
|
Democrat |
88% |
12% |
|
Republican |
62% |
38% |
|
Independent |
71% |
29% |
|
Male |
73% |
27% |
|
Female |
76% |
24% |
|
18-29 |
67% |
33% |
|
30-49 |
68% |
32% |
|
50-69 |
77% |
23% |
|
Over 65 |
86% |
14% |
|
No College Degree |
66% |
34% |
|
College Degree |
89% |
11% |
|
White |
73% |
27% |
|
Non-White |
76% |
24% |
“There are major health risks for those that receive a COVID-19 vaccination.”
|
|
Strongly Agree |
Somewhat Agree |
Somewhat Disagree |
Strongly Disagree |
Not Sure (VOL) |
|
Democrat |
7% |
13% |
24% |
55% |
2% |
|
Republican |
33% |
26% |
14% |
20% |
7% |
|
Independent |
8% |
20% |
26% |
39% |
8% |
|
Male |
15% |
21% |
18% |
38% |
8% |
|
Female |
19% |
20% |
23% |
35% |
3% |
|
18-29 |
18% |
19% |
28% |
31% |
5% |
|
30-49 |
19% |
24% |
21% |
29% |
6% |
|
50-69 |
19% |
14% |
17% |
42% |
7% |
|
Over 65 |
12% |
25% |
18% |
44% |
2% |
|
No College Degree |
23% |
24% |
20% |
27% |
6% |
|
College Degree |
7% |
15% |
22% |
53% |
3% |
|
White |
17% |
22% |
20% |
35% |
5% |
|
Non-White |
17% |
16% |
22% |
39% |
5% |