Muhlenberg College Public Health Program: April 2020 Pennsylvania Health Survey
The following report (April 2020 Pennsylvania Public Health Survey, PDF) provides findings from the annual Muhlenberg College Public Health Program Survey of Pennsylvanians on public health issues. This year’s survey examined topics that included health care reform, heroin addiction, immunizations, marijuana legalization, the coronavirus outbreak and the performance of President Trump’s handling of health care matters.
"This year's survey results show growth in the number of Pennsylvanians that think providing health care coverage is the responsibility of the federal government, with 6 in 10 now holding this view," says Christopher Borick, director of the Muhlenberg College Institute of Public Opinion. "It's notable we fielded this year's survey during the first two weeks of March as the COVID-19 outbreak expanded in the United States."
The survey marks the eighth year of this initiative that is a partnership between the Muhlenberg College Institute of Public Opinion (MCIPO) and the Muhlenberg College Public Health Program. The results of the coronavirus questions (Q: 24 and 25) were released in an earlier report (March 2020 Pennsylvania Public Health Poll—Coronavirus Report), and the results of questions on sports safety (Q: 21-23) will be released in a separate report.
KEY FINDINGS
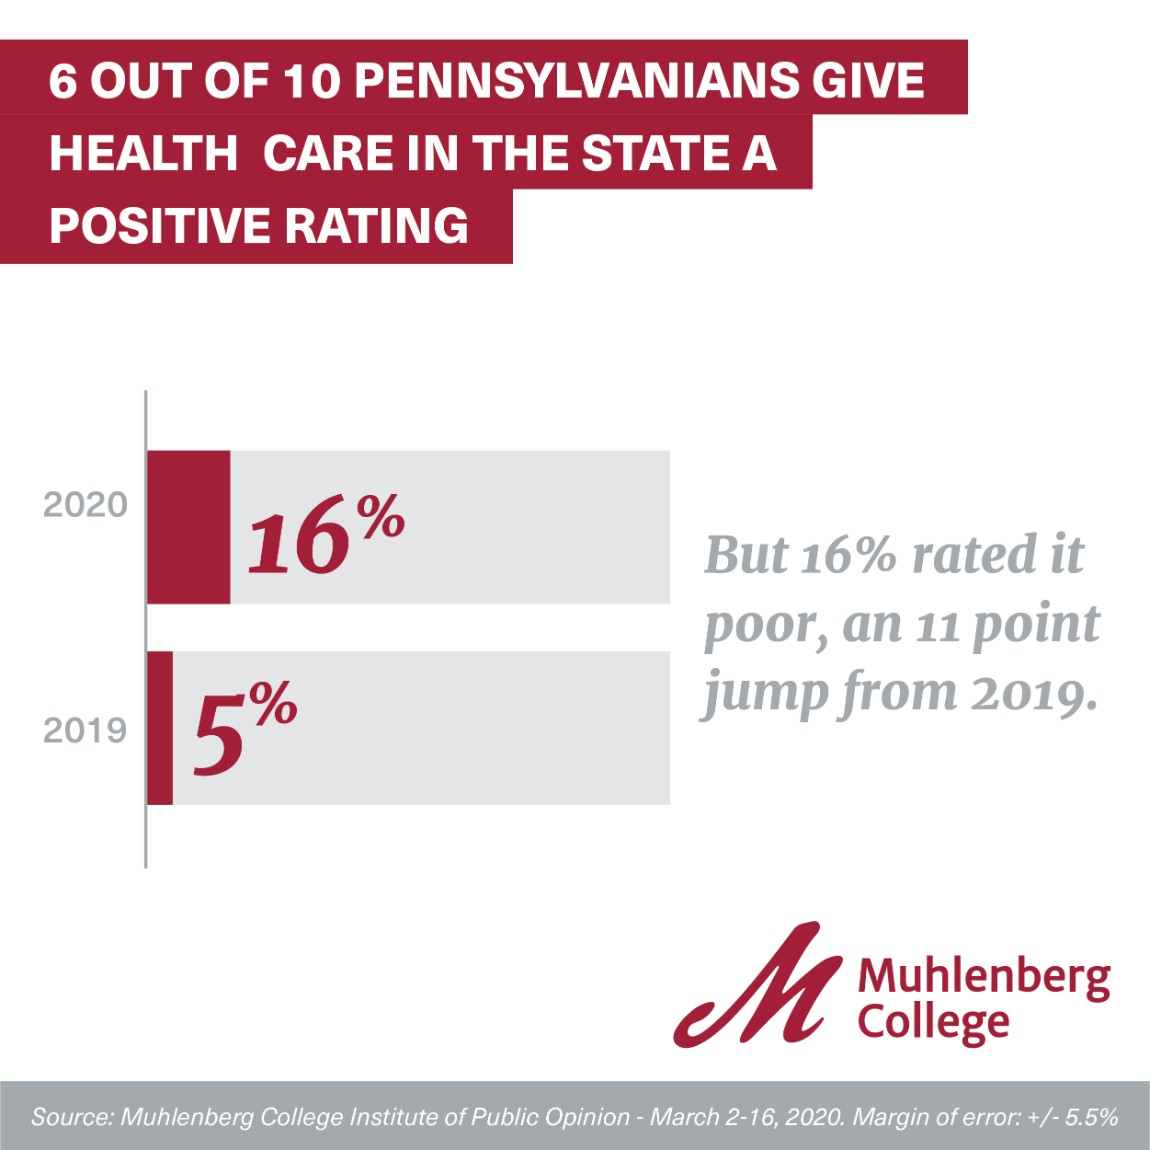
- About 6 out of 10 adult Pennsylvanians gave health care in the state a positive rating (“excellent” 17%, “good” 42%), but 16% rated health care in Pennsylvania as poor, marking an 11 point jump from 2019, when only 5% of state residents offered this rating.
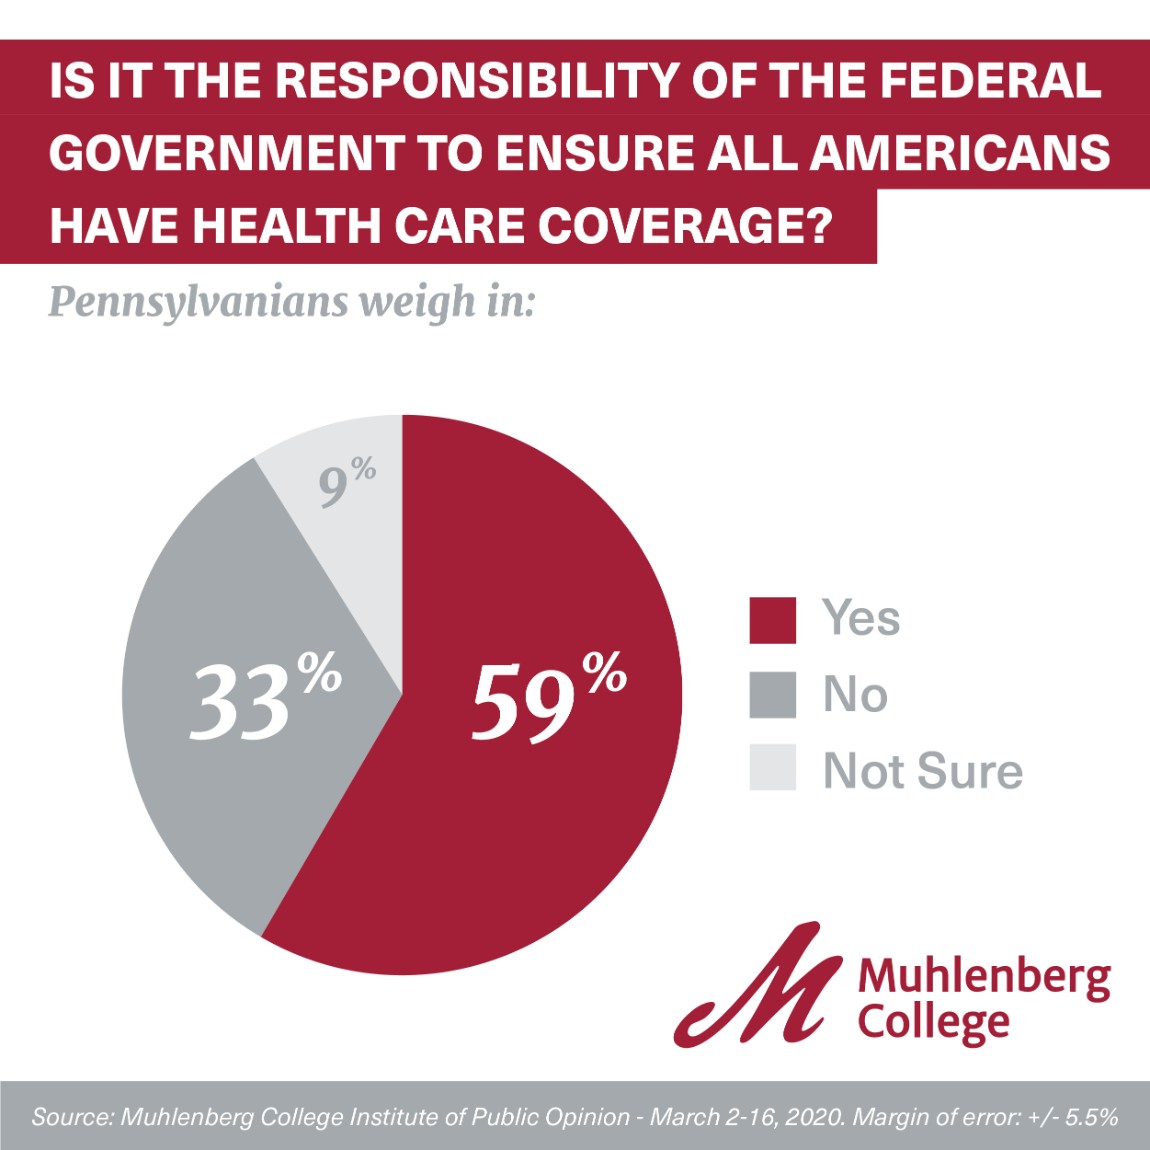
- Nearly 6 in 10 Pennsylvanians (59%) think it is the responsibility of the federal government to make sure that all Americans have health care coverage. This is an increase of 5% since 2019, when 54% of Pennsylvanians maintained this view.
- Pennsylvanians are fairly divided on a proposed “Medicare for all” plan, with 48% favoring such a proposal and 40% opposing this option.
- While divided on “Medicare for all,” 3 out of 4 Pennsylvanians support a “public option” under which the federal government would allow individuals to purchase Medicare or keep their private insurance.
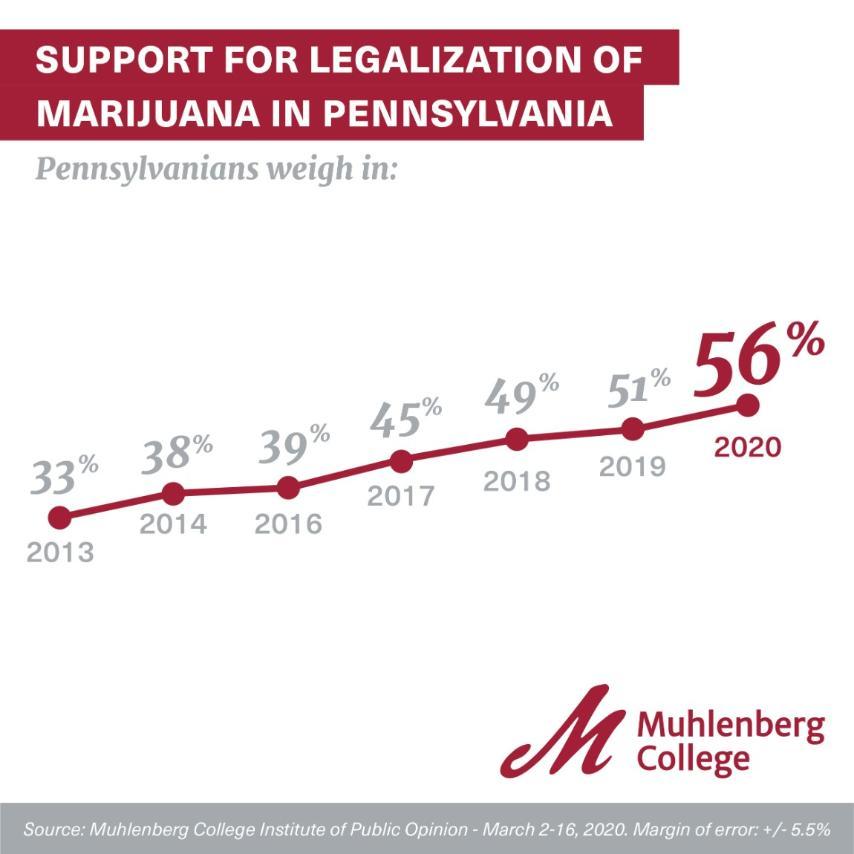
- Support for legalization of marijuana in Pennsylvania rose to its highest level in the history of this poll (dating back to 2013), with 56% of Keystone State adults now supporting legalization, compared to a record low of 26% opposing this policy option.
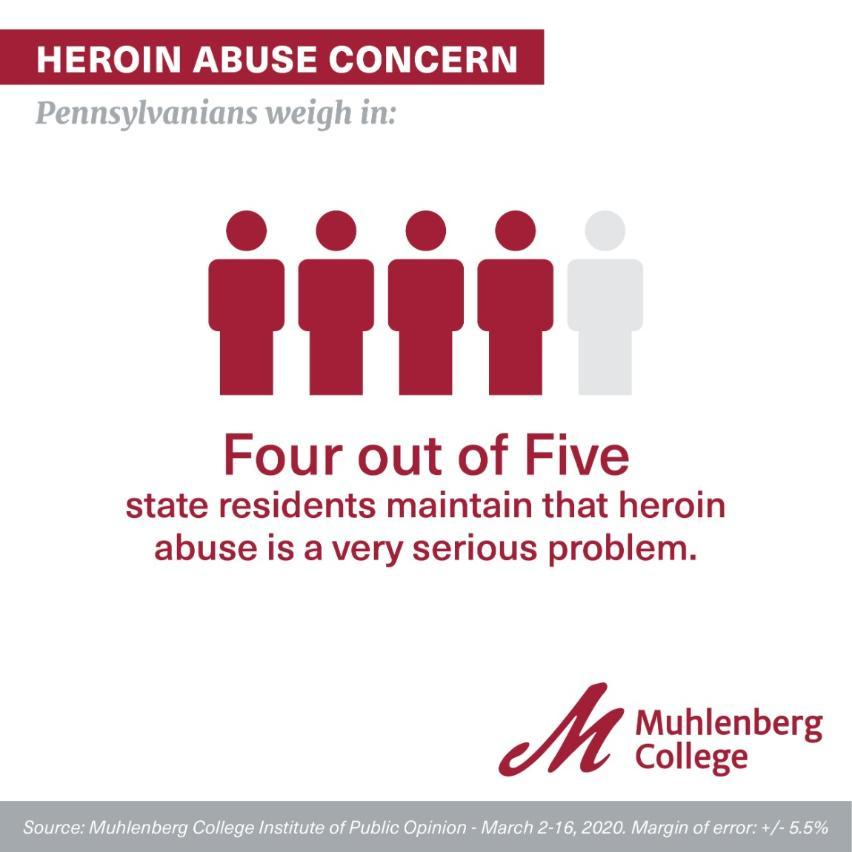
- 4 out of 5 of Commonwealth residents maintain that heroin abuse is a very serious problem, but there is strong division on the use of supervised injection sites for individuals addicted to heroin or other opiates, with 45% supporting this option and 45% opposed.
- A record number of Pennsylvanians (57%) strongly disagree with the claim that childhood immunizations increase the likelihood of a child becoming autistic, marking a 22 point increase since 2013, when only 35% of adult Pennsylvanians strongly disagreed with this claim.
- "The growth in the number of Pennsylvanians that reject claims that childhood immunizations cause autism is a positive sign that public health communication efforts do have an effect," says Borick. "It's hard to get rid of unfounded or erroneous beliefs once they take hold, but in the case of the immunization-autism link, progress is being made."
- Over 7 out of 10 Commonwealth residents (71%) disagree with the claim that children in the United States receive “too many immunizations.”
- A majority (54%) of Pennsylvanians believe vaping and e-cigarettes pose a “major risk” to public health in the Keystone State.
- "The much publicized increase in the number of vaping-related illnesses, particularly among young people, has likely contributed to a greater understanding of the health risks associated with vaping and e-cigarettes," says Muhlenberg's Director of Public Health Chrysan Cronin. "In addition, many people may have a personal connection to someone who has suffered from a vaping-related illness so they may be more aware of the health risks."
- For the second year in a row, most residents of the Commonwealth (51%) believe climate change poses a major risk to public health in Pennsylvania.
April 2020 Pennsylvania Public Health Survey (PDF)
Methodological Statement
The following report contains the results of a telephone survey of 420 adults in the Commonwealth of Pennsylvania between March 2 and 16, 2020. Respondents were interviewed in English on both landlines (83) and cell phones (337). With a randomly selected sample of respondents, the margin of error for the surveys is +/- 5.5% at a 95% level of confidence. Margins of error for questions with smaller sample size will be larger. In addition to sampling error, one should consider that question wording and other fielding issues could introduce error or bias into survey results. The sample data has been weighted by gender, race, age, income and educational attainment to reflect those Pennsylvania population characteristics as reported by the United States Census Bureau in 2019. The calculation of sampling error takes into account design effects due to the weighting identified above. In order to reach a representative sample of adult Pennsylvanians, both landlines and cell phones are called up to 5 times. The response rate for this survey as calculated using the American Association of Public Opinion Research (AAPOR) RRII formula is approximately 8%. Due to rounding the totals provided in the frequency report may not total 100%. The survey instrument was designed by Christopher P. Borick, Director of the MCIPO and Professor in the Public Health Program, in conjunction with students in the Public Health Program at Muhlenberg College. The survey was funded exclusively by Muhlenberg College. For more detailed information on the methods employed, please contact the MCIPO at 484-664-3444 or email [email protected].
INSTRUMENT AND FREQUENCY
Q1: Thank you. Just to confirm, are you a resident of Pennsylvania who is age 18 or older?
- Yes…………....CONTINUE
- No………………THANK AND DISCONTINUE
- Not Sure….…THANK AND DISCONTINUE
HEALTH INSURANCE/GENERAL HEALTH CARE
Q2: In general would you describe the quality of health care in Pennsylvania as excellent, good, fair or poor?
- Excellent………17%
- Good……..……..42%
- Fair……………...24%
- Poor……………..16%
- Not sure (Volunteered)..<1%
|
|
Spring 2019 |
Spring 2020 |
|
Excellent |
20% |
17% |
|
Good |
47% |
42% |
|
Fair |
25% |
24% |
|
Poor |
5% |
16% |
|
Not sure (Volunteered) |
3% |
<1% |
Q3: Do you approve or disapprove of the way President Donald Trump is handling the issue of health care?
- Approve………..34%
- Disapprove……..49%
- Not sure (Volunteered)..17%
|
|
Spring 2017 |
Spring 2018 |
Spring 2019 |
Spring 2020 |
|
Approve |
34% |
31% |
28% |
34% |
|
Disapprove |
47% |
51% |
51% |
49% |
|
Not Sure |
20% |
19% |
20% |
17% |
Q4: Which one of the following comes closest to your opinion about what Congress should do with the Affordable Care Act known as Obamacare? Let it stand. Change it so it does more. Change it so it does less. Repeal it completely.
- Let it stand…………………………..9%
- Change it so it does more…….46%
- Change it so it does less…………3%
- Repeal it completely………………29%
- Not sure (Volunteered)……………13%
|
|
Spring 2018 |
Spring 2019 |
Spring 2020 |
|
Let it stand |
11% |
14% |
9% |
|
Change it so it does more |
47% |
47% |
46% |
|
Change it so it does less |
3% |
11% |
3% |
|
Repeal it completely |
29% |
21% |
29% |
|
Not sure (Volunteered) |
10% |
7% |
13% |
Q5: Do you think it is the responsibility of the federal government to make sure all Americans have health care coverage, or is that not the responsibility of the federal government?
- Is a federal responsibility……………...59%
- Is not a federal responsibility…………33%
- Not sure (Volunteered)……...……………9%
|
|
Spring 2019 |
Spring 2020 |
|
Is a federal responsibility |
54% |
59% |
|
Is not a federal responsibility |
38% |
33% |
|
Not sure |
9% |
9% |
Q6: Next, I'm going to read you some different health care proposals. For each one, please let me know if you strongly favor, somewhat favor, somewhat oppose or strongly oppose it. First: Having a national health plan, sometimes called Medicare-for-all, in which all Americans would get their insurance from a single government plan
- Strongly favor…………………………27%
- Somewhat favor………………………21%
- Somewhat oppose………………….10%
- Strongly oppose……………………….30%
- Not sure (Volunteered)..…………12%
Q7: Next, an optional government-administered health plan similar to Medicare that would be open to anyone, but would allow people to keep the coverage they have if they prefer
- Strongly favor…………………………40%
- Somewhat favor……………………….35%
- Somewhat oppose……………………..6%
- Strongly oppose………………………...9%
- Not sure (Volunteered) ………………11%
MARIJUANA AND HEROIN
Q8: Next, I would like to ask you a question about marijuana. First, do you favor, oppose or neither favor nor oppose the complete legalization of the use of marijuana for any purpose?
- Favor……………………… 56%
- Oppose…………………….26%
- Neither favor or oppose..12%
- Not sure (Volunteered)……6%
|
|
Spring 2013 |
Spring 2014 |
Spring 2016 |
Spring 2017 |
Spring 2018 |
Spring 2019 |
Spring 2020 |
|
Favor |
33% |
38% |
39% |
45% |
49% |
51% |
56% |
|
Oppose |
40% |
35% |
38% |
29% |
30% |
28% |
26% |
|
Neither favor or oppose |
24% |
22% |
20% |
23% |
19% |
18% |
12% |
|
Not sure |
3% |
4% |
3% |
3% |
3% |
3% |
6% |
Q9: How serious of a problem do you think Heroin abuse in America is? (READ LIST)
- Very serious………….…82%
- Somewhat serious……13%
- Not at all serious…….….1%
- Not sure (Volunteered).…4%
|
|
Spring 2016 |
Spring 2017 |
Spring 2018 |
Spring 2019 |
Spring 2020 |
|
Very serious |
75% |
87% |
84% |
81% |
82% |
|
Somewhat serious |
17% |
10% |
14% |
17% |
13% |
|
Not at all serious |
2% |
1% |
1% |
1% |
1% |
|
Not sure |
7% |
2% |
2% |
1% |
4% |
Q10: Do you personally know anyone who has been addicted to heroin or another opiate?
- Yes………………..63%
- No………………...37%
- Not sure…………..<1%
|
|
Spring 2016 |
Spring 2017 |
Spring 2018 |
Spring 2019 |
Spring 2020 |
|
Yes |
52% |
58% |
55% |
64% |
63% |
|
No |
44% |
40% |
45% |
34% |
37% |
|
Not sure |
4% |
2% |
1% |
2% |
<1% |
Q11: Do you strongly support, somewhat support, somewhat oppose or strongly oppose opening clinics where people using heroin and other opiates could take their drugs under medical supervision so that medical staff could revive anyone who overdoses?
- Strongly support…….…… 23%
- Somewhat support……… 22%
- Somewhat oppose………..11%
- Strongly oppose…………...34%
- Not sure………………………..11%
Q12: Do you strongly support, somewhat support, somewhat oppose or strongly oppose sending people to prisons or jails against their will for addiction treatment?
- Strongly support.…………..9%
- Somewhat support……….14%
- Somewhat oppose………..20%
- Strongly oppose…………...47%
- Not sure………………………..11%
IMMUNIZATION
Q13: Please indicate if you strongly agree, somewhat agree, somewhat disagree or strongly disagree with the following statements. First, the chances of a child getting autism are increased if they receive the recommended childhood immunizations.
- Strongly agree………..…...8%
- Somewhat agree………....8%
- Somewhat disagree…….13%
- Strongly disagree………..57%
- Not sure (Volunteered)..15%
|
Spring 2013 |
Spring 2014 |
Spring 2015 |
Spring 2016 |
Spring 2017 |
Spring 2018 |
Spring 2019 |
Spring 2020 |
|
|
Strongly Agree |
5% |
8% |
7% |
6% |
4% |
8% |
9% |
8% |
|
Somewhat Agree |
13% |
13% |
10% |
13% |
13% |
13% |
9% |
8% |
|
Somewhat Disagree |
22% |
21% |
22% |
16% |
14% |
14% |
16% |
13% |
|
Strongly Disagree |
35% |
39% |
48% |
51% |
48% |
49% |
55% |
57% |
|
Not Sure |
26% |
19% |
12% |
14% |
21% |
16% |
11% |
15% |
Q14: Immunizations pose little health risks to those that receive them.
- Strongly agree………..…49%
- Somewhat agree………..25%
- Somewhat disagree…….8%
- Strongly disagree………..8%
- Not sure (Volunteered)…10%
|
Spring 2019 |
Spring 2020 |
|
|
Strongly Agree |
54% |
49% |
|
Somewhat Agree |
23% |
25% |
|
Somewhat Disagree |
9% |
8% |
|
Strongly Disagree |
9% |
8% |
|
Not Sure |
4% |
10% |
Q15: In general, children in the United States receive too many immunizations.
- Strongly agree………..…10%
- Somewhat agree………. 9%
- Somewhat disagree……20%
- Strongly disagree……… 51%
- Not sure (Volunteered)…10%
|
Spring 2013 |
Spring 2014 |
Spring 2015 |
Spring 2016 |
Spring 2017 |
Spring 2018 |
Spring 2019 |
Spring 2020 |
|
|
Strongly Agree |
8% |
12% |
10% |
11% |
11% |
20% |
12% |
10% |
|
Somewhat Agree |
9% |
10% |
13% |
11% |
15% |
12% |
10% |
9% |
|
Somewhat Disagree |
20% |
22% |
18% |
21% |
20% |
19% |
23% |
20% |
|
Strongly Disagree |
53% |
47% |
56% |
49% |
47% |
41% |
48% |
51% |
|
Not Sure |
10% |
9% |
3% |
8% |
7% |
8% |
8% |
10% |
THREATS TO PUBLIC HEALTH
Q16: Next I’m going to read you a list of factors that may or may not affect the health of the public in Pennsylvania. For each factor that I note please indicate of you think that factor poses a major risk, minor risk or no risk to public health in Pennsylvania. First, (ROTATE QUESTIONS)
Vaping and electronic cigarettes
- Major risk………………54%
- Minor risk………………36%
- No risk………………….. 5%
- Not sure………………….5%
Q17: Next, fracking for natural gas and oil.
- Major risk……………… 36%
- Minor risk……………… 31%
- No risk………………….. 9%
- Not sure………………….24%
|
Spring 2019 |
Spring 2020 |
|
|
Major Risk |
38% |
36% |
|
Minor Risk |
39% |
31% |
|
No Risk |
3% |
9% |
|
Not Sure |
11% |
24% |
Q18: Climate change
- Major risk……………….51%
- Minor risk………………28%
- No risk…………………..14%
- Not sure…………………...8%
|
Spring 2019 |
Spring 2020 |
|
|
Major Risk |
51% |
51% |
|
Minor Risk |
26% |
28% |
|
No Risk |
20% |
14% |
|
Not Sure |
4% |
8% |
Q19: Texting while driving
- Major risk………………93%
- Minor risk……………… 6%
- No risk…………………..<1%
- Not sure………………….1%
|
Spring 2019 |
Spring 2020 |
|
|
Major Risk |
87% |
93% |
|
Minor Risk |
13% |
6% |
|
No Risk |
<1% |
<1% |
|
Not Sure |
<1% |
1% |
Q20: Firearms
- Major risk……………..33%
- Minor risk………………41%
- No risk………………….21%
- Not sure………………….5%
SPORTS INJURIES
QUESTIONS 21-23 ON SPORTS INJURIES AND SAFETY WILL BE RELEASED IN A SEPARATE REPORT
CORANAVIRUS (RESULTS RELEASED IN MARCH 2020 REPORT)
Q24: Next I have a few questions about the coronavirus. Are you very concerned, concerned, not very concerned, or not concerned at all about the spread of coronavirus in the U.S.?
- Very concerned……………………………36%
- Concerned……………………………………38%
- Not very concerned…………………….15%
- Not concerned at all……………………10%
- Not sure……………………………………….2%
Q25: Do you think U.S. Government officials are doing enough or not enough to prevent the spread of coronavirus in the U.S.?
- Enough……………………………………….. 48%
- Not enough…………………………………… 40%
- Not sure……………………………………….. 12%
DEMOGRAPHICS
Q26: Finally, I have a few questions about yourself. First, what is your current marital status?
|
Single |
34% |
|
Married |
42% |
|
Separated |
2% |
|
Divorced |
8% |
|
Widowed |
9% |
|
Partnered |
3% |
|
Not sure |
2% |
Q27: What is your highest level of education? Is it (READ LIST)?
|
Less Than High School |
5% |
|
High School Graduate |
30% |
|
Some College Or Technical School |
28% |
|
College Graduate (4 Yr Only) |
24% |
|
Graduate Or Professional Degree |
14% |
Q28: Which of the following categories best describes your racial identity? (READ LIST)
|
White/Caucasian |
74% |
|
African-American |
11% |
|
Hispanic/Latino |
5% |
|
Asian |
3% |
|
Native American |
<1% |
|
Mixed Race |
3% |
|
Or Other |
4% |
Q29: Which of the following categories best describes your current voting status? Are you registered as a (READ LIST)?
|
Democrat |
40% |
|
Republican |
34% |
|
Independent |
14% |
|
Other Party |
4% |
|
Or Not Registered To Vote In Pennsylvania |
2% |
|
Not Sure |
6% |
Q30: Which of the following categories best describes your religious affiliation? Are you (READ LIST)?
|
Catholic |
23% |
|
Protestant |
31% |
|
Jewish |
2% |
|
Muslim |
1% |
|
Hindu |
<1% |
|
Other Religion (Including Agnostic) |
27% |
|
Atheist |
9% |
|
Not Sure |
7% |
Q31: How many children do you have under 18? ______
|
Has Children Under 18 |
75% |
|
No Children Under 18 |
25% |
Q32: Which of the following best describes your health care insurance status. Are you primarily insured:
|
By A Plan Provided By Your Employer |
46% |
|
By A Plan That You Purchase Individually |
8% |
|
By Medicaid Coverage |
6% |
|
By Medicare Coverage |
22% |
|
Uninsured |
5% |
|
Other |
10% |
|
Not Sure |
3% |
Q33: In which of the following age categories does your current age fall. READ LIST
|
18-29 |
22% |
|
30-49 |
30% |
|
50-64 |
26% |
|
65 and Older |
23% |
Q34: Which of the following categories best describes your family income? (READ LIST)
|
Under $20,000 |
14% |
|
$20,000-$40,000 |
20% |
|
$40,000-$60,000 |
19% |
|
$60,000-$80,000 |
17% |
|
$80,000-$100,000 |
12% |
|
Over $100,000 |
18% |
Q35: Finally to which gender identity do you most identify? (READ LIST)
|
Male |
49% |
|
Female |
51% |
|
Transgender Male |
0% |
|
Transgender Female |
0% |
|
Or you do not identify as male, female or transgender |
<1% |